Collecting high-resolution aeromagnetic data is only the first step. The true value of a magnetic survey lies in unlocking the structural framework of your project area.
Structurally controlled mineral deposits, such as orogenic gold in the Canadian Shield or unconformity-related uranium in the Athabasca Basin, require a deep understanding of subsurface architecture. At Radai Canada, we utilize proprietary, in-house processing software to extract maximum geological insight from both scalar and vector magnetic data, delivering actionable intelligence directly to your exploration team.
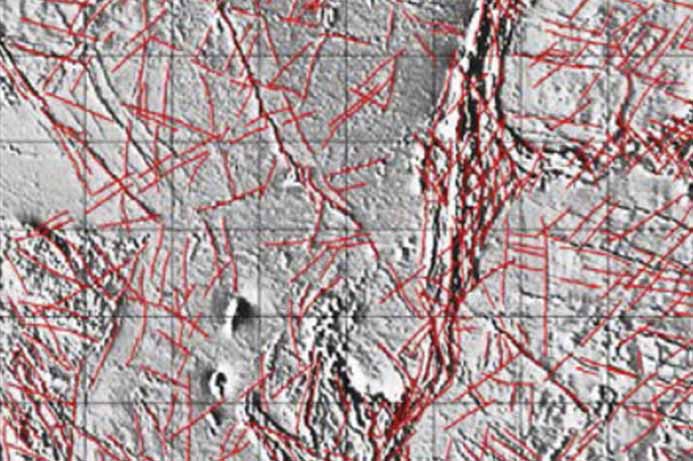
The bedrock of our interpretation service is the precise identification and characterization of structural expressions. We process your magnetic datasets through advanced derivative filters to map.
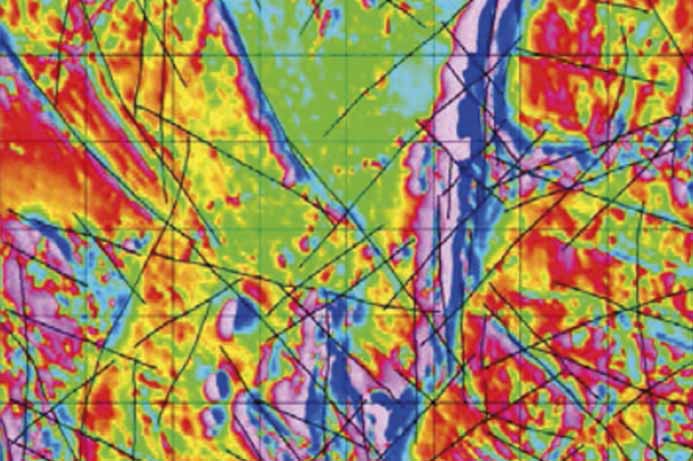
Identifying critical fluid pathways for mineral deposits.
Mapping the complex geometry of deformed stratigraphy.
Connecting local structures to regional geological trends.
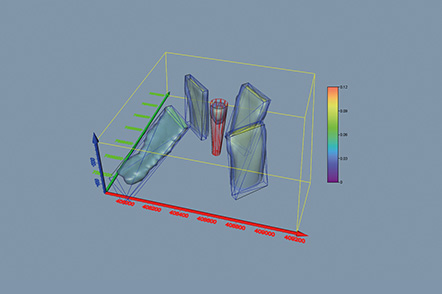
We remove the guesswork from your exploration program. By utilizing semi-automated structural interpretation algorithms, we objectively highlight anomalous zones, structural traps, and complex intersections. This data-driven approach allows for easier, more confident decision-making when prioritizing drill collars and trenching programs.
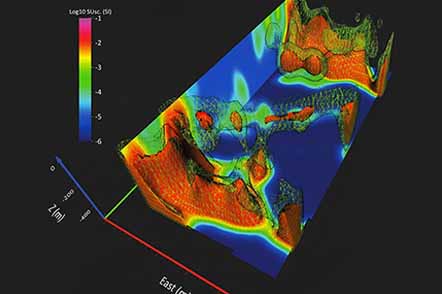
A static map only tells part of the story. Our structural interpretations help clarify the tectonic evolution and kinematics of your survey area. By analyzing cross-cutting relationships, offset magnetic units, and remanent magnetization signatures, we help your geologists reconstruct the deformational history that localized your target mineralization.
Standard industry software often relies on manual, time-consuming line-drawing that is subject to human bias. Radai employs specialized, in-house processing tools designed specifically for semi-automated lineament extraction. This ensures a more objective, comprehensive, and rapid structural analysis.
If your data was collected using Radai’s drone-based 3-component fluxgate magnetometers, our structural interpretation becomes even more powerful. The XYZ vector components significantly reduce the ambiguity of traditional Total Magnetic Intensity (TMI) data, making it easier to identify the dip of geological contacts and distinguish between overlapping structural events.
We provide our interpretations in GIS-ready formats (Shapefiles, DXF, Geodatabases) alongside comprehensive technical reports. Your team receives clean, layered data that plugs seamlessly into QGIS, ArcGIS, or Leapfrog, ready to be combined with your geochemistry and drilling databases.
info@radai.ca